Graphs with CSV Data
How to visualize data from a CSV file in Qt Graphs.
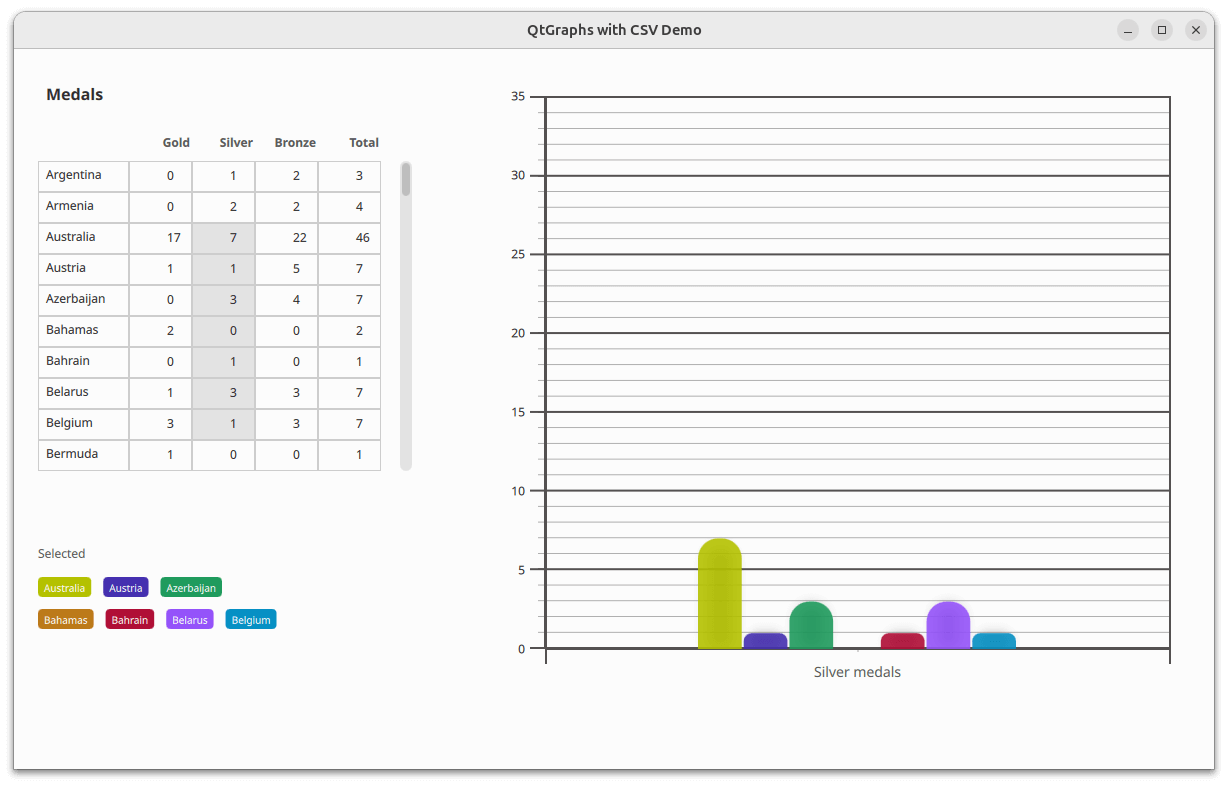
The Graphs with CSV Data example shows how to display data from a CSV file in a 2D bar chart. The application reads the CSV file using a third-party CSV parser. The data is inserted into a custom model that inherits from the QAbstractTableModel. After the data is inserted into the model, the leftmost column contains the vertical header data, while the top row contains the horizontal header data.
The selected third-party library knows nothing about Qt Resource System, so it cannot load the CSV file from the file path. Therefore, the source's contents must be loaded before passing it to the library. The CSV library in this example accepts the file as either file path, std::fstream, or std::stringstream. Since the CSV file is in Qt resources, the library doesn't know how to load it, and QFile doesn't support std::fstream; the only option left is to use std::stringstream. The whole file can be read into a string via QFile::readAll(), and then that string is opened into a std::stringstream.
In the application window, a table view presents the data from the model. From the table view, a user can select a subsection of data that is then displayed in the bar graph.
As the bar series doesn't modify category axis labels, updating the series doesn't update the axis labels. That is handled in JavaScript by extracting label names from the model's leftmost column. The extracted label names are then set to the category axis's labels property.
     function extractBarSetGategories(first, count) {
         var categories = [];
         const last = first + count;
         for (var i = first; i < last; ++i)
             categories.push(tv.model.headerData(i, Qt.Horizontal, Qt.DisplayRole) + " medals");
         return categories;
     }
Running the Example
To run the example from Qt Creator, open the Welcome mode and select the example from Examples. For more information, see Qt Creator: Tutorial: Build and run.
See also QML Applications.